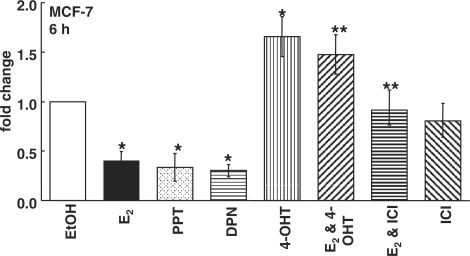
Figure 1.
E2 inhibits miR-21 expression. Summary of Q-PCR data on (mature) miR-21 expression. MCF-7 cells were treated with EtOH, 10 nM E2, 10 nM PPT (ERα-selective), or 10 nM DPN (ERβ-selective) for 6 h. as indicated by the different fills. Where indicated MCF-7 cells were pretreated with 100 nM ICI 182 780 [ICI, an ER antagonist termed a ‘selective ER disrupter’ (SERD)] or 100 nM 4-OHT for 6 h and then ethanol or 10 nM E2 was added for an additional 6 h. Values are fold increase compared to EtOH for each miRNA and were calculated as described in ‘Materials and Methods’ section. Values are the average of three to eight separate experiments ± SEM. *Significantly different from the EtOH control, P < 0.05. **Significantly different from E2, P < 0.05.

