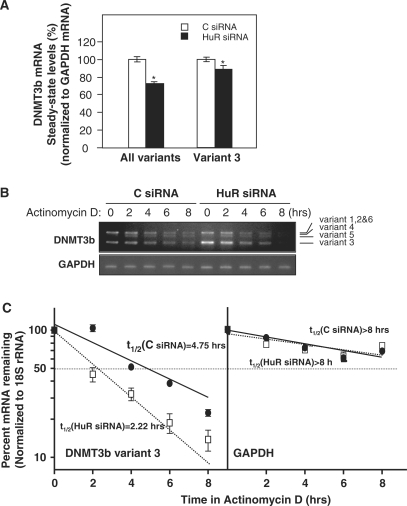
Figure 3.
HuR silencing reduces DNMT3b mRNA stability and mRNA levels. (A) Two days after siRNA transfection, RKO cells were harvested, and RNA was analyzed by RT–qPCR (shown as the mean ± SEM from three experiments; *P ≤ 0.05). (B) The DNMT3b mRNA stability after silencing HuR was studied by incubating cells with actinomycin D, extracting total RNA at the times shown, and measuring DNMT3b mRNA levels by RT–PCR. Representative PCR products of all DNMT3b variants visualized in ethidium bromide-stained agarose gels are shown; the levels of GAPDH served to verify equal sample input. (C) DNMT3b variant 3 mRNA levels were measured by RT–qPCR. The data were normalized to 18S (housekeeping) mRNA levels and represented as a percentage of the mRNA levels measured at time 0, before adding actinomycin D, using a semilogarithmic scale. The half-lives (indicated) were calculated as the time required for DNMT3b variant 3 mRNA decrease to 50% of its initial abundance (discontinuous horizontal line). Data represent the mean ± SEM from three independent experiments.

