Figure 5.
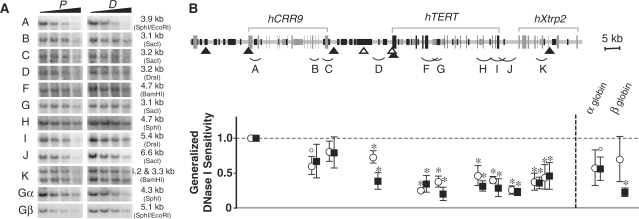
General DNase I sensitivity of the genomic region containing hCRR9, hTERT and hXtrp2 loci in proliferating and differentiated HL60 cells. For differentiation, HL60 cells were treated with DMSO for 4 days. (A) Southern blots of genomic fragments following DNase I digestion. Nuclei isolated from proliferating and differentiated HL60 cells were treated with increasing concentration of DNase I (2, 4, 8 and 16 U/ml). Genomic DNAs were digested with restriction enzymes and analyzed by Southern analyses using probes specified in Supplementary Table 2. Restriction enzymes used for genomic DNA digestion and sizes of genomic fragments are indicated on the right side of each panel set. The two bands of fragment K were caused by a polymorphic mini-satellite sequence. Gα, α-globin; Gβ, β-globin. (B) The upper diagram is a schematic display of the genomic sequence. The chart below shows the calculated general DNase I sensitivities of the chromosomal fragments corresponding to their positions (A–K), as described in ‘Materials and Methods’ section. Closed triangles depict DHSs present in both proliferating and differentiated cells, whereas open triangles indicate DHSs present only in proliferating cells. Genomic fragments that have been examined by DNase I digestion were indicated by arcs below the diagram. The values in the chart are averages of the lanes treated with 4, 8 and 16 U/ml DNase I, relative to fragment A (designated as 1.0). Open circles and closed squares represent proliferating cells (P) and differentiated cells (D), respectively. ° and * indicate P < 0.05 and P < 0.01, relative to fragment A, by Student's t-test. There were no statistical differences in general DNase I sensitivities between corresponding chromatin fragments in proliferating and differentiated HL60 cells, except for fragment D, for which P = 0.03.

