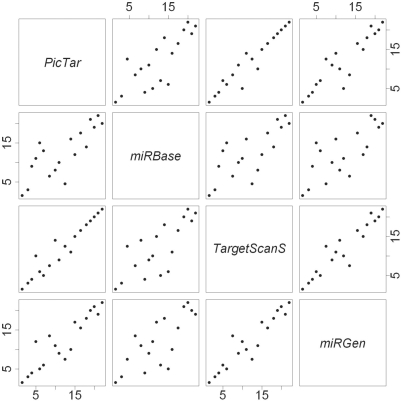
Figure 1.
Pair-wise concordance between miRNA rankings obtained for time-lag 0 using PicTar, TargetScanS, miRBase and miRGen. The plot is represented as a 4 × 4 grid with the upper-diagonal cells and the lower diagonal cells being mirror images. For example, while the graph in cell (1, 2) has PicTar rankings on the Y-axis and miRBase rankings on the X-axis, the graph in cell (2, 1) has PicTar rankings on the X-axis and miRBase rankings on the Y-axis.

