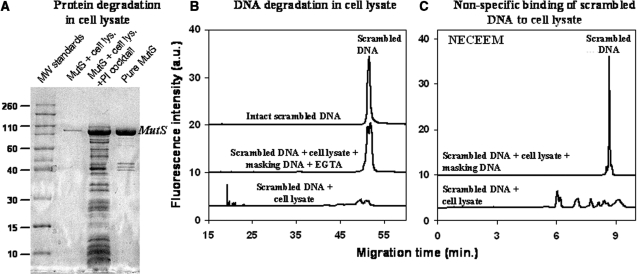
Figure 2.
Three processes that interfere with aptamer development for a target protein in cell lysate: protein degradation (A), DNA degradation (B) and binding of DNA by non-target components of cell lysate (C). (A) MutS degradation was analyzed by SDS–PAGE with Coomassie staining. The four lanes (from left to right) in the gel image correspond to: (i) molecular weight standards (×1000), (ii) MutS degraded by proteases in the cell lysate, (iii) MutS rescued from proteolysis in the cell lysate by a protease inhibitor (PI) cocktail, and (iv) pure MutS. The samples analyzed contained 972 µg/ml of cell lysate protein and 54 µg/ml of MutS. (B) DNA degradation was analyzed by gel capillary electrophoresis (Gel CE) using a scrambled 80-nt DNA as an experimental model. The three traces (from bottom to top) correspond to: (i) scrambled DNA degraded in cell lysate, (ii) scrambled DNA rescued from the degradation in the cell lysate by masking DNA and EGTA and (iii) scrambled DNA as a control. (C) Binding of DNA to non-target components of the cell lysate was studied by NECEEM using the scrambled DNA. The two traces (from bottom to top) in (C) correspond to: (i) scrambled DNA bound to non-target components of the cell lysate and/or partially degraded DNA and (ii) scrambled DNA rescued from binding and degradation by masking DNA. NECEEM was carried out in a 50-cm-long capillary at an electric field of 400 V/cm with 50 mM Tris–acetate at pH 8.3 as a run buffer.

