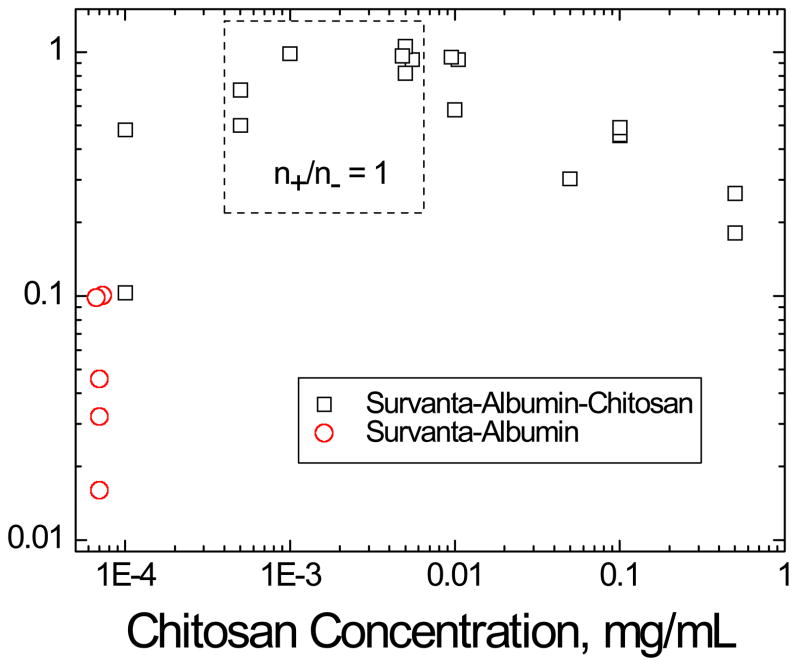
Figure 6.
Relative adsorption (RA) of 800 μg Survanta on subphases containing 2 mg/mL albumin at varying chitosan concentrations. □ Survanta-albumin-chitosan; ○ Survanta-albumin, which as been plotted at a chitosan concentration of 7×10⁻⁵ mg/mL for comparison purposes. RA is the difference between the sample surface pressure (Π) and the surface pressure of the albumin only isotherm (ΠAlb, red curve in Fig. 1b), divided by the difference between the clean interface isotherm (no albumin), ΠSat, and ΠAlb, . All surface pressures were evaluated by averaging over the same trough area, A0, denoted by the shaded area in Fig. 2. The relative adsorption increases with chitosan concentration to an optimum value of RA ~ 1 at .001 – 0.005 mg/mL chitosan and then decreases with subsequent increases in chitosan concentration. The dashed box indicates the calculated (Table 1) chitosan concentration range where n+/n− = 1 (0.0005–0.005 mg/mL). The optimum RA occurs in this chitosan concentration range consistent with a chitosan neutralizing the negative surface charge on the albumin and surfactant, thereby eliminating the electrostatic energy barrier to surfactant adsorption. Higher chitosan concentrations above n+/n− = 1 lead to charge reversal as excess chitosan adsorbs to the albumin and surfactant, leading to a net positive charge in the double layer and a restored energy barrier to adsorption (Eqn. 1–3).

