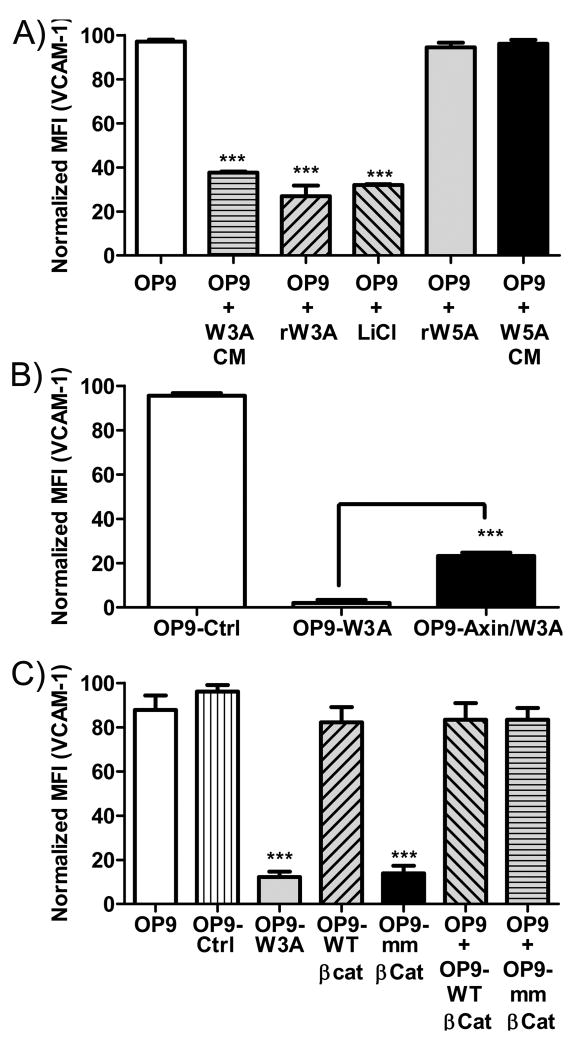
Figure 3.
Canonical Wnt signaling inhibits VCAM-1 expression. OP9 or vector transduced OP9 cells were cultured in medium alone, medium with the indicated molecules or in co-culture with the indicated transduced OP9 cells. The three panels indicate averaged and normalized (to control) VCAM-1 mean fluorescence intensities (MFI) determined by flow cytometry. (A) Normalized MFIs on OP9 cells were measured by FACS. CM indicates conditioned media from indicated cell lines, while rW3A and rW5A represent recombinant forms of Wnt3a or Wnt5a respectively. (B) Normalized MFIs are shown for control vector transduced OP9 (OP9-Ctrl), OP9-W3A or OP9-W3A cells transduced with an axin construct (OP9-Axin/Wnt3a). (C) Normalized surface VCAM-1 MFI from flow cytometry analysis are given for OP9 cells transduced with a wild type (WT)-β-catenin construct, a constitutively active (mm)-β-catenin construct or control vector (OP9-Ctrl). Surface VCAM-1 expression on OP9 (GFP-) cells after co-culture with OP9-WT-β-Cat (GFP+) or OP9-mm-β-Cat (GFP+) are also given. Shown is one representative experiment of four that produced similar results. Error bars indicate standard errors from replicate wells set-up at the same time and asterisks indicate statistical significances, *** (p<0.0001).

