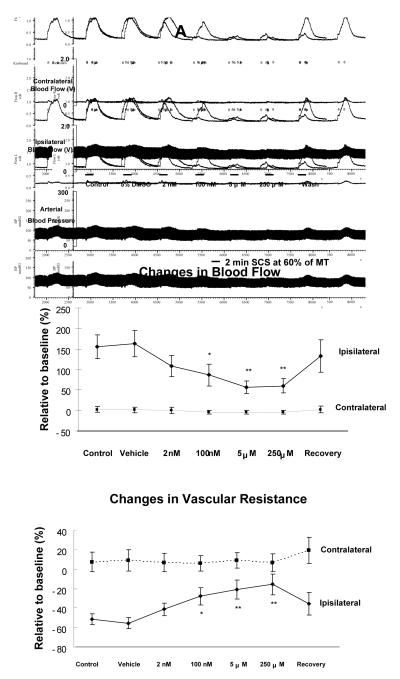
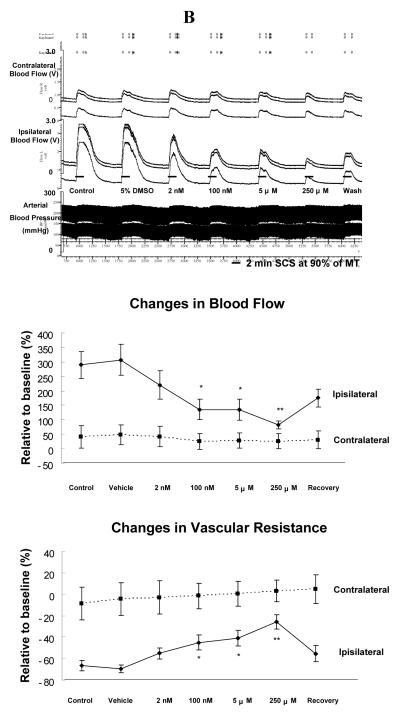
Figure 1. Effects of U0126 on SCS-induced vasodilation.
(A) Changes of blood flow and vascular resistance produced by SCS at 60% of MT before and after topical application of U0126 on the surface of L3-L5 spinal cord. Top panel: A representative example of changes in ipsilateral and contralateral blood flow and arterial blood pressure during SCS at 60% of MT, before and after administration of U0126 ( 2 nM, 100 nM, 5 μM and 250 μM; 10 minutes each ). Middle panel: A summary of the percent changes in blood flow in the ipsilateral and contralateral hindpaws in response to 2 minutes SCS at 60% of MT. Bottom panel: A summary of the percent changes in vascular resistance in the ipsilateral and contralateral hindpaws in response to 2 minutes SCS at 60% of MT. * P<0.05, ** P<0.01, compared to control group. (B) Changes of blood flow and vascular resistance produced by SCS at 90% of MT before and after topical application of U0126 on the surface of L3-L5 spinal cord. The figure legends are the same as those in Fig 1A, except that intensity of SCS is 90% of MT, instead of 60%.


