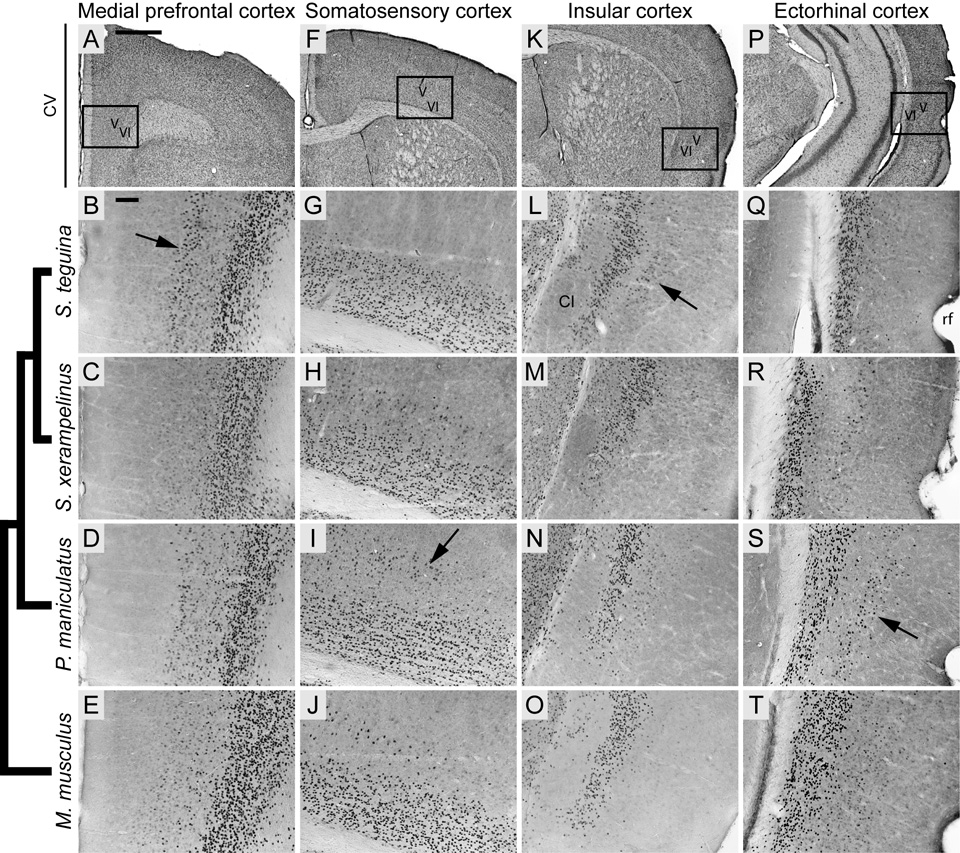
Fig. 1.
Cortical distribution of Foxp2 in four species of muroid rodents, showing high conservation in layer VI and variable expression in layer V. Phylogenetic relationships represented by cladogram on left after Steppan et al. (2004) and Reeder et al. (2006). A, F, K and P are coronal cresyl violet (CV) sections from S. teguina; boxed areas identify representative examples of Foxp2 expression from approximately the same levels in B–E, G–J, L–O and Q–T, respectively. B–E: Layer V Foxp2 expression in medial prefrontal cortex (ctx) is pronounced in S. teguina (arrow in B), lacking in S. xerampelinus and weak in P. maniculatus and M. musculus. G–J: Layer V Foxp2 expression in medial somatosensory ctx is lacking in S. teguina and most pronounced in P. maniculatus (arrow in I). L–O: Layer V Foxp2 expression in insular ctx at level of claustrum (CL) is pronounced in S. teguina (arrow in L), weak in S. xerampelinus and P. maniculatus and absent in M. musculus. Q–T: Layer V Foxp2 expression at ectorhinal/perirhinal ctx transition medial to the rhinal fissure (rf) is most pronounced in P. maniculatus (arrow in S). All sections are from adult males; females are indistinguishable from conspecific males. Scale bars = 500 µm in A (applies to A, F, K, P); 100 µm in B (applies to B–E, G–J, L–O, Q–T).

