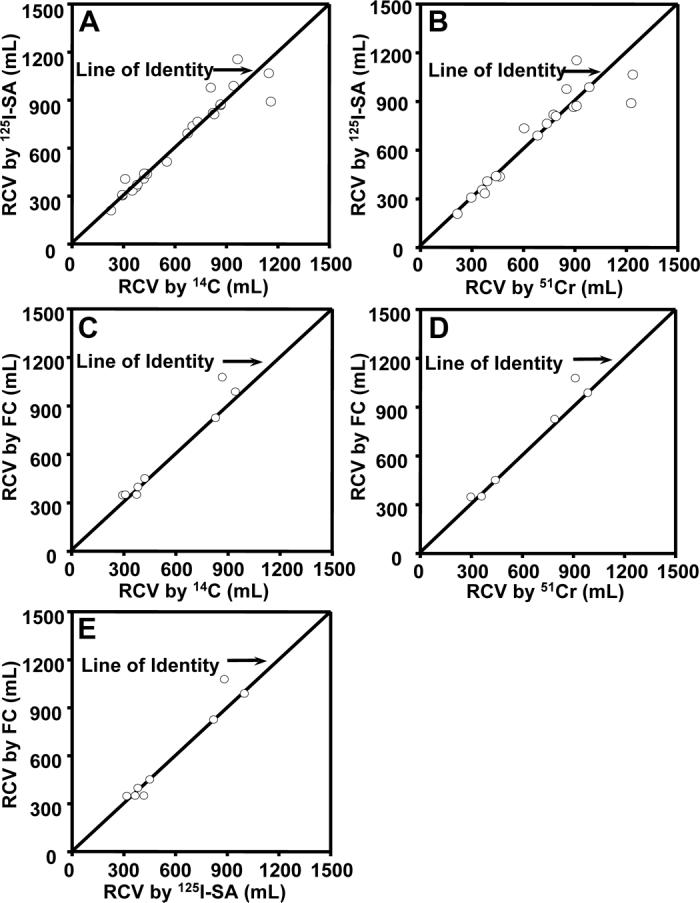
Figure 2.

Pair-Wise Comparisons of Different Methods for Determining Red Cell Volume (RCV) in the Same Sheep. A. Biotin method with (125I)streptavidin (125I-SA) detection versus (14C)cyanate (14C) method in n = 23 sheep. The correlation coefficient of the regression line was 0.95. B. Biotin method with 125I-SA detection versus 51Cr method in n = 19 sheep. The correlation coefficient of the regression line was 0.85. C. Biotin method with flow cytometric (FC) enumeration versus (14C) in n = 8 sheep. The correlation coefficient of the regression line was 0.96. D. Biotin method with FC enumeration versus 51Cr method in n = 6 sheep. The correlation coefficient of the regression line was 0.97. E. Biotin method with 125I-SA detection versus biotin method with FC enumeration in n = 8 sheep. The correlation coefficient of the regression line was 0.95. For all panels, error bars for analytical triplicates are consistently less than the symbol size.
