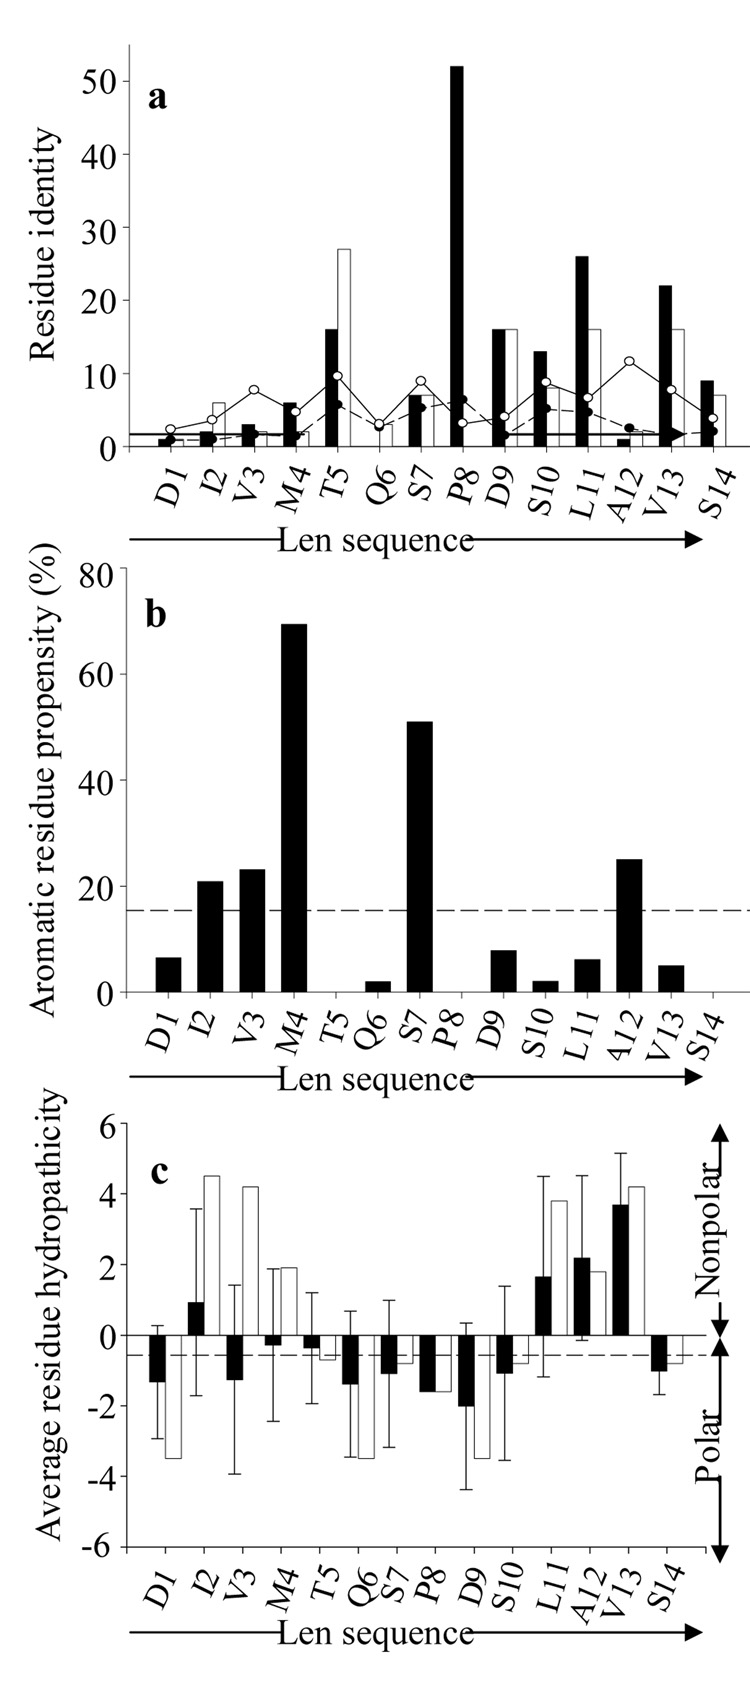
FIGURE 2.
Sequence-position comparison of 11-1F4-binding phage peptides with the first 14 residues of VL Len. (a) Residue identity between phage peptides and VL Len; the number of identical (closed bars) and chemically similar (open bars) residues for each position are shown. The solid and open circles indicate the number of identical and chemically similar phage peptide residues expected to occur by chance, based on the observed frequency of amino acids in the random peptide phage display library (http://www.neb.com/nebecomm/ManualFiles/manualE8110.pdf). (b) Percentage of aromatic residues in the phage peptides at each position. The line dashed represents the percentage abundance of aromatic amino acids relative to all other residues in the random peptide phage display library. (c) Average residue hydropathicity values (33) for phage peptides (closed bars) relative to those of the Len(1–14) peptide (open bars). Each sequence position average hydropathicity value was determined from the sum of residue hydropathicity values divided by the number of total residues. The dashed line shows the average hydropathicity value for all 20 amino acids, corrected for the abundance of each in the random peptide phage display library. All sequence-position comparisons were determined using the multiple sequence alignments shown in Figure 1.

