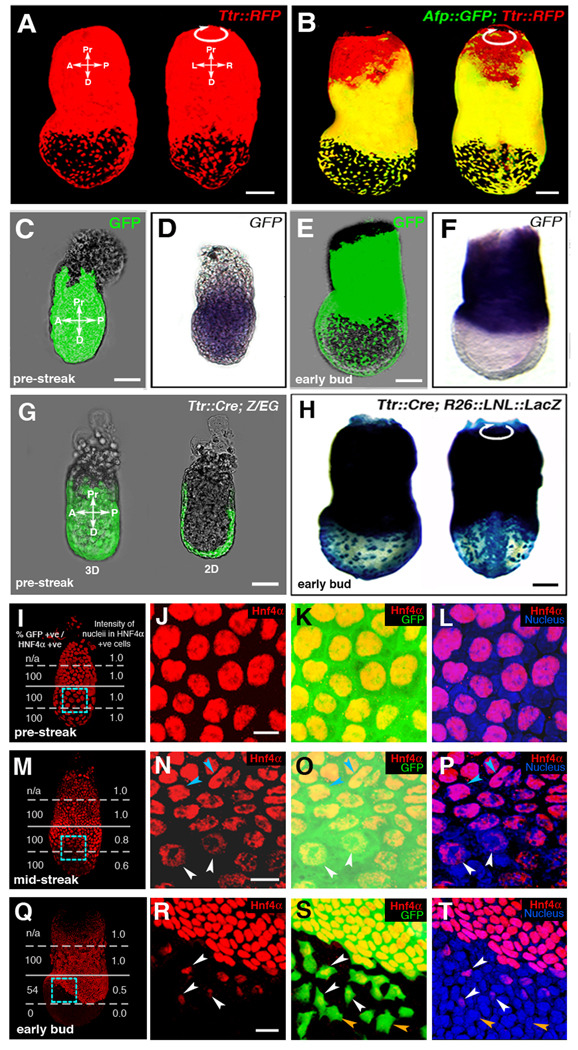
Figure 2. Fluorescent proteins as cell tracers in visceral endoderm derived cells that are downregulating marker genes.
(A and B) Two distinct visceral endoderm-specific cis-regulatory elements identify the same population of cells. (A) 3D reconstruction of z-stack acquired from an EB stage (E7.5) Ttr::RFPTg/+ transgenic projected laterally (left) and posteriorly (right). (B) 3D reconstruction of z-stack from an Afp::GFPTg/+; Ttr::RFPTg/+ transgenic projected laterally (left) and posteriorly (right). Co-expressing cells are yellow.
(C–F) Localization of GFP protein (green fluorescence, C and E) and mRNA (blue staining, D and F) in PS and EB stage Afp::GFPTg/+ embryos. (C and D) PS stage embryo imaged live for GFP protein (C), then processed for GFP mRNA in situ hybridization (D). (E and F) EB stage embryo imaged live (E), then processed for mRNA in situ hybridization (F).
(G and H) Cre recombinase-mediated excision labels the entire visceral endoderm at PS stages in Ttr::CreTg/+ ; Z/EG embryos (green fluorescence, G), while visceral endoderm-derived cells overlying the epiblast is labeled in Ttr::CreTg/+ ; R26::LNL::LacZ+/− embryos at the EB stage (blue staining, H).
IHC of PS stage (I–L), MS stage (M–P) and EB stage (Q–T) Afp::GFPTg/+ embryos. GFP (green), Hnf4α (red) and Hoechst (labeling nuclei - blue). (I, M and Q) 3D reconstructions of z-stacks quantifying Hnf4a expression in distinct regions of each embryo. Percentage of GFP+ cells that are also Hnf4a+ (left column); average fluorescence intensity of Hnf4a+ nuclei (right column). High-magnification 3D single and merged channel views of boxed regions (J–L, N–P and R–T). GFP+ cells with high levels of Hnf4α (blue arrowheads), GFP+ cells expressing reduced levels of Hnf4α (white arrowheads), GFP+ cells with no detectable Hnf4α (orange arrowheads). Pr, proximal; D, distal; A, anterior; P, posterior; L, left; R, right; 3D, 3-dimensions; 2D, 2-dimensions. Scale bars = 20 µm in J,N and R; 50 µm in C and G; 100 µm in A,B,E and H.

