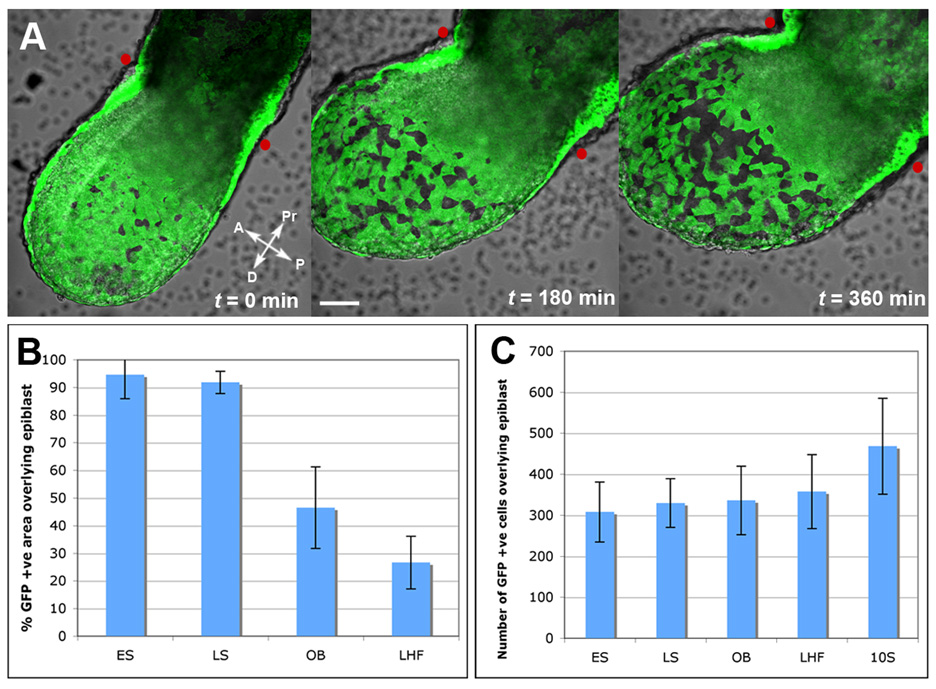
Figure 4. Dynamics of visceral endoderm cell dispersal.
(A) Still images from 3D time-lapse movie (Supplementary movie 8) of an Afp::GFPTg/+ embryo from LS to EB stage. Red dots correspond to the position of the amnion, the morphological landmark of the boundary between the extraembryonic and embryonic part of the conceptus. Scale bar = 50µm.
(B) Histograms depicting fluorescence area overlying the epiblast in ES (N=7), LS (N=6), OB (N=20), to LHF (N=5) stages.
(C) Histograms depicting GFP+ cells overlying the epiblast at 10 somite (10S, N=9) stage.

