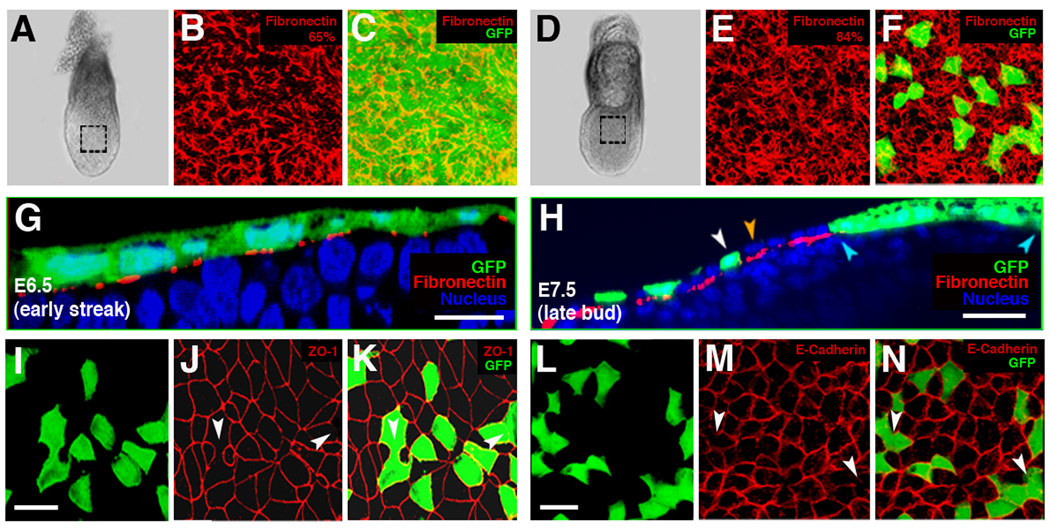
Figure 5. Intercalation of epiblast-derived and visceral endoderm cells on the surface of the embryo.
(A, D) Wholemount view of ES (A) and EB (D) stage embryos used for IHC to fibronectin.
(B–C and E–F) 3D reconstruction of z-stacks in boxed region of A (B–C) or D (E–F), depicting a filamentous fibronectin network. Percentages in (B) and (E) depict density of fibronectin as quantified by positive area of red channel under equal threshold and magnification in the two embryonic stages.
(G) yz view of EB stage Afp::GFPTg/+ embryo reveals a contiguous sheet of GFP+ cells covering the fibronectin matrix (red) on the surface.
(H) yz view of LB stage Afp::GFPTg/+ embryo reveals intercalation of GFP+ and GFP− cells at the LB stage. Isolated GFP+ cells (white arrowheads); GFP− cells neighboring isolated GFP+ cells positioned on the same side of the fibronectin matrix (orange arrowheads).
(I–K) 3D reconstructed z-stacks taken through the region overlying the epiblast of LB (E7.5) stage Afp::GFPTg/+ embryo visualized for ZO-1. Interfaces lacking ZO-1 (white arrowheads).
(L–N) 3D reconstructed z-stacks through the region overlying the epiblast of LB (E7.5) stage Afp::GFPTg/+ embryo visualized for E-cadherin. Junctions exhibiting reduced E-cadherin (white arrowheads). Scale bars = 50 µm.

