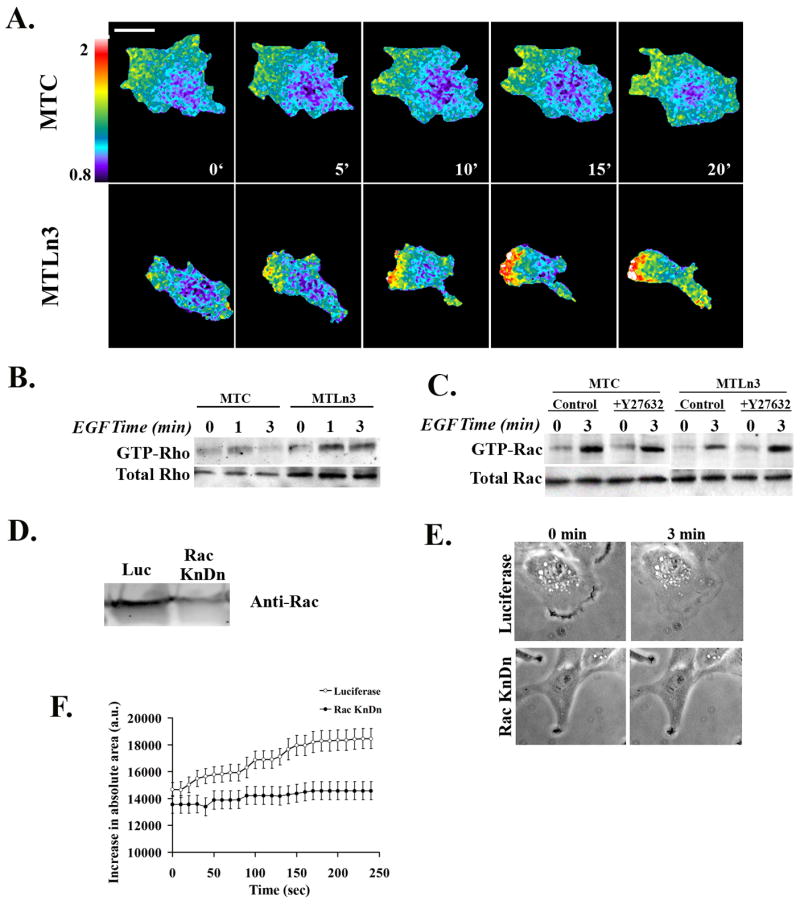
Figure 7. MTC cells have decreased RhoA activity, increased Rac activity, and show Rac-dependent protrusion.

A) Time-lapse FRET imaging of MTC cells (upper panels) or MTLn3 cells (lower panels) expressing the RhoA biosensor, moving randomly in 5% serum. Cells were imaged for CFP and FRET every minute for 30 minutes and the FRET/CFP ratios obtained (movie S6). The data are representative of two independent experiments, and five time lapse series. B) Representative Western blot of a GST-RBD pull-down showing Rho activation in MTC and MTLn3 cells. The lower gels show the amount of total Rho in cell lysates. The data are representative of two independent experiments. C) GST-CRIB pull-downs from MTC or MTLn3 cells, treated with carrier or Y27632-treated, and blotted with anti-Rac antibody. Lower gels show total Rac in cell lysates. The data are representative of two independent experiments. D) Anti-Rac blot of lysates from control or Rac1 siRNA-treated MTC cells. E) Representative frames from time-lapse images of control or Rac1 siRNA-treated MTC cells, stimulated with EGF for 0 or 3 min (from Movie S7). F) Surface area of control or Rac1 siRNA-treated MTC cells, after stimulation with EGF. The data show the mean ± SEM from 10 cells per condition, from two separate experiments.
