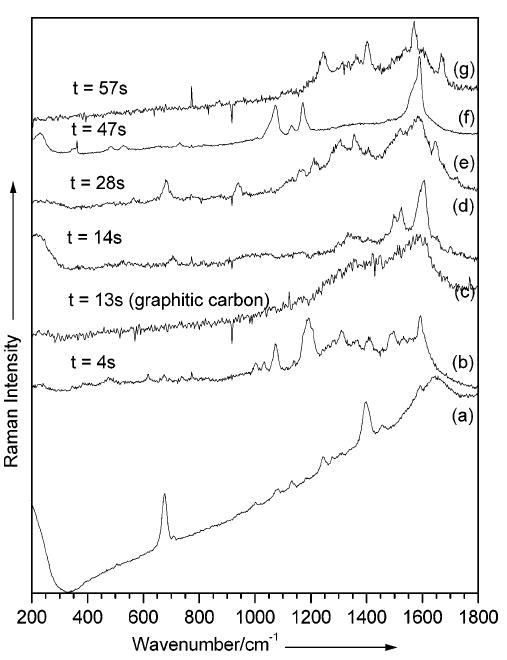
Figure 3.

Time-resolved SERS spectra collected at 1-s intervals (b–g) from the metal–(K105C/S115C protein)–metal nanogap of an aggregate deposited on a glass cover slip (5 × 10⁻⁹ M). Six spectra were selected to highlight sudden spectral changes in intensity and position. Excitation line, 514.5 nm; laser power at the sample, 0.05 mW; acquisition time, 1 s. (a) Average SERS spectrum obtained in a buffer solution (from Figure 2b), included for comparison reasons.
