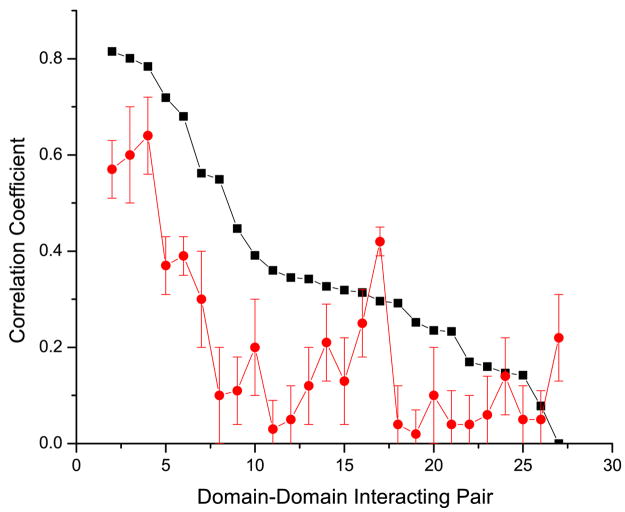
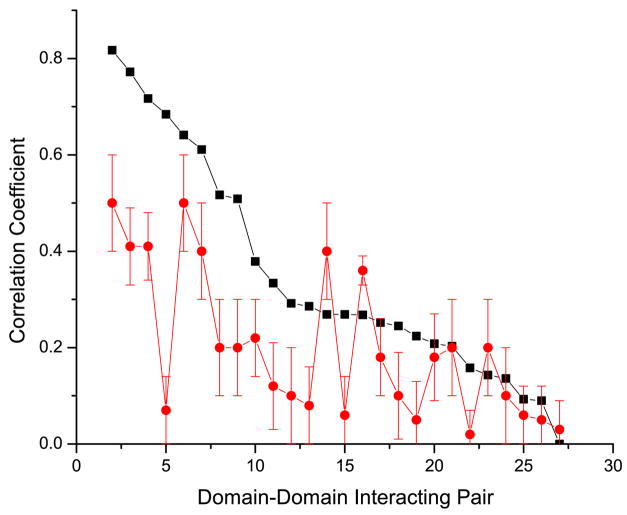
Figure 2.
Comparison of the correlation coefficients for each domain-domain interacting pair using the binding neighborhood (black), and an equivalent number of randomly selected columns (red). The values in the x-axis, labeled 1 to 26, represent each of the domain-domain interacting pairs sorted in descending order by the corresponding correlation coefficient when using the binding neighborhood. Results in panels a and b were obtained using the orthogonal and non-orthogonal speciation corrections respectively. For randomized experiments we plot the mean value and represent the standard deviation based on 100 trials as the error bar.


