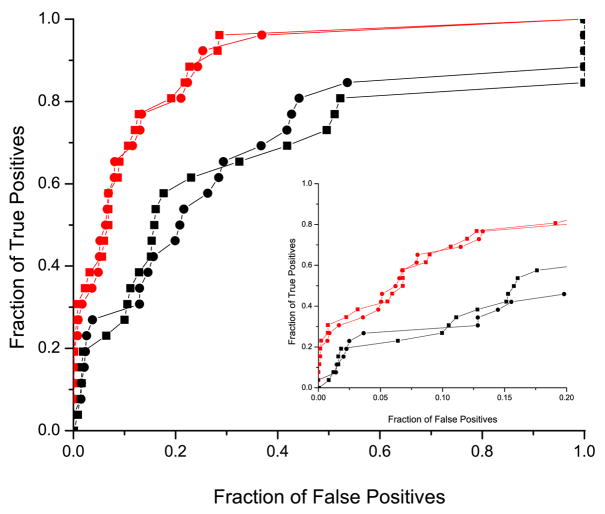
Figure 3.
Comparison of the performance of the mirrortree method on the binding neighborhood and on the randomly selected MSA columns set of the same size. The red lines correspond to the performance using the binding neighborhood with corrections from the orthogonal speciation subtraction (circles) and non-orthogonal speciation subtraction (squares). The corresponding graphs for randomly selected residues are drawn in black. Insert shows ROC curves for up to 20% false positive rate.

