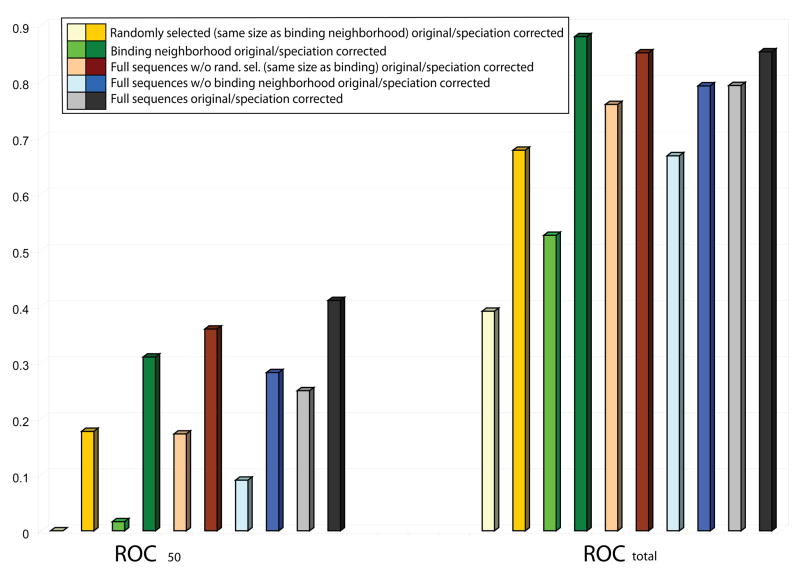
Figure 4.
Dependence of ROC results on the columns used in the alignment and on the speciation correction used in the analysis. Results for ROCtotal and ROC50 show the following trends. Regardless of the region of the sequence used, the performance of the method with the correction for speciation (darker colors) is better than that of the original mirrortree without the correction (lighter colors). In particular, using the full length sequence with speciation correction yields, for ROC50, the best results (grey), and substracting a set of randomly selected non-binding columns (brown) represents only a slight decrease in the performance, while subtracting the binding neighborhood (cyan) to the full sequence represents a significant decrease on the overall performance of the method. Finally, performance using the binding neighborhood alone (green) is significantly better than using a randomly selected set of columns of the same size but not belonging to the binding neighborhood (yellow).

