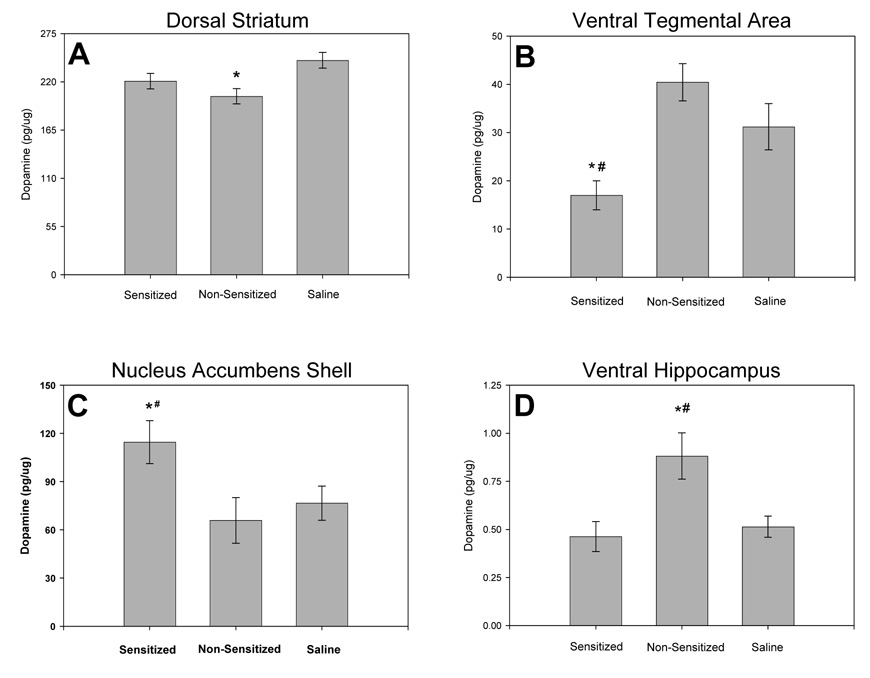
Fig. 7.
Dopamine concentrations in the limbic and nigrostriatal systems at 17 days of withdrawal. Dopamine concentrations in (A) the dorsal striatum, (B) the ventral tegmental area, (C) the shell of the nucleus accumbens, and (D) in the ventral hippocampus, for sensitized rats, non-sensitized rats and saline-treated controls. * represents significant differences from the saline-treated group, # represents significant differences between sensitized and non-sensitized groups. (Amphetamine-sensitized: N=10, non-sensitized: N=6, saline: N=16; means ± S.E.M. are shown for all groups).

