
Figure 2.
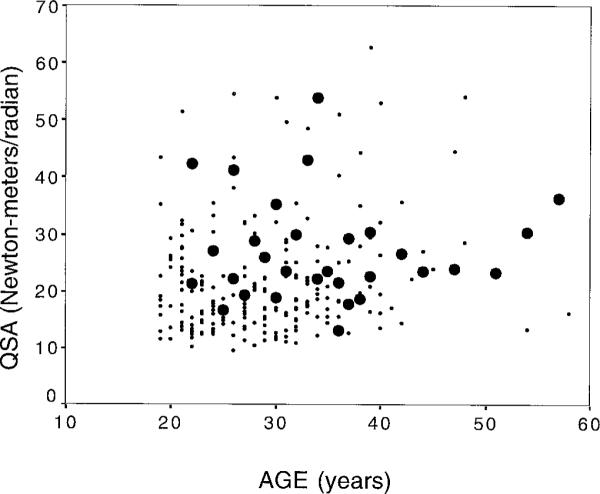
Scatterplot of quantitative spasticity assessment (QSA) by age and human T-cell lymphotrophic virus type I (HTLV-I) serostatus. ●, positive; •, negative.
Official websites use .gov
A
.gov website belongs to an official
government organization in the United States.
Secure .gov websites use HTTPS
A lock (
) or https:// means you've safely
connected to the .gov website. Share sensitive
information only on official, secure websites.
Scatterplot of quantitative spasticity assessment (QSA) by age and human T-cell lymphotrophic virus type I (HTLV-I) serostatus. ●, positive; •, negative.