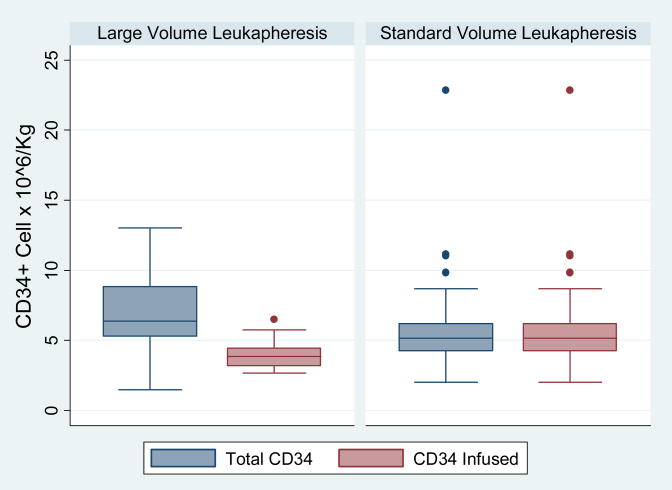
Figure 2.
Box plot the shows the distribution of total number of CD34+ cell for all collections and number of CD34+ cell infused between LVL and SVL groups. The upper border of the the box represents the 75 percentile and lower border represents the 25 percentile of the distribution. The median is represented by a line within the box. The whiskers of the plot represent the 99 percentile range and the solid dots represent the CD34+ cell dose that are beyond the 99 percentile of the distribution.

