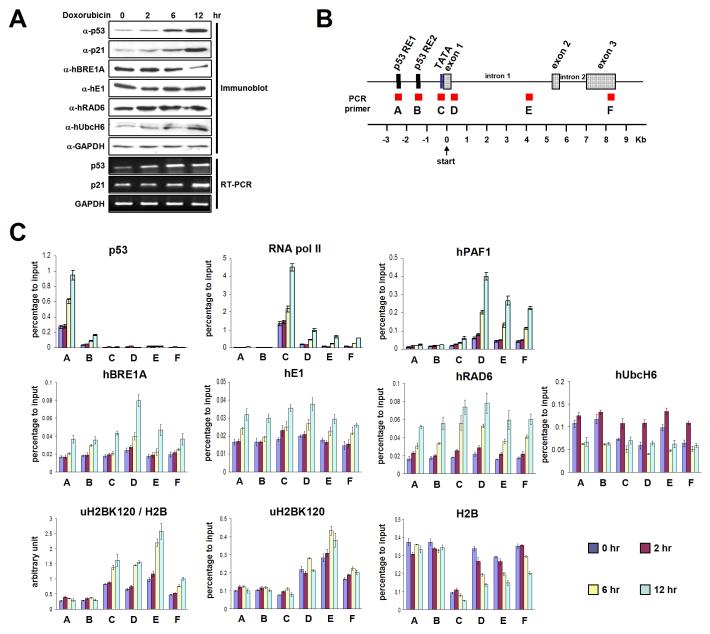
Figure 7. Distribution of the H2B Ubiquitylation Factors and Ubiquitylated H2B on the p21 Locus during p53-Dependent Transcription.
(A) Doxorubicin induction of p53 and the p21 target gene. HCT116 cells were treated with 0.5 μM doxorubicin for the indicated times, and proteins and mRNA levels were analyzed by immunoblot and RT-PCR, respectively. (B) Schematic representation of the p21 locus indicating six amplicons used for real-time PCR. (C) ChIP analyses on the p21 locus. Cells were treated as in (A) and ChIP analyses were performed with indicated antibodies. Error bars denote standard deviations from three independent PCR reactions from a single ChIP that is representative of several that were performed. [Note: these data are part of a comprehensive ChIP analysis and limited parts (e.g., p53 and p21 expression data and p53 and Pol II ChIP data) are expected to be published, for cross reference, with more extensive data on SII and individual hPAF complex subunit analyses.]

