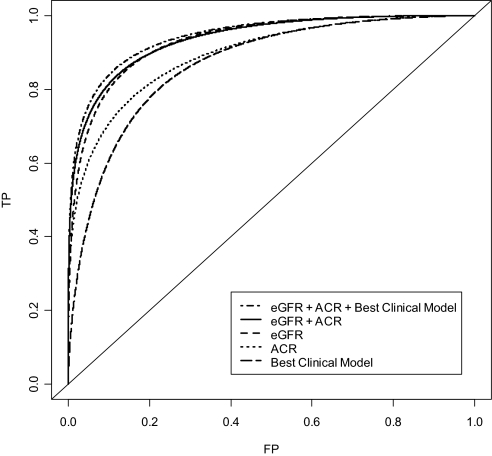
Figure 2.
Diagnostic accuracy of prognostic markers for future ESRD in the general population. The ROC curves show true-positive (TP) rates (i.e., sensitivity) for all possible false-positive (FP) rates (i.e., 1 − specificity). Increasing AUC indicates better diagnostic accuracy, and the clinical relevant region of the curve is at low FP rates (<0.10).

