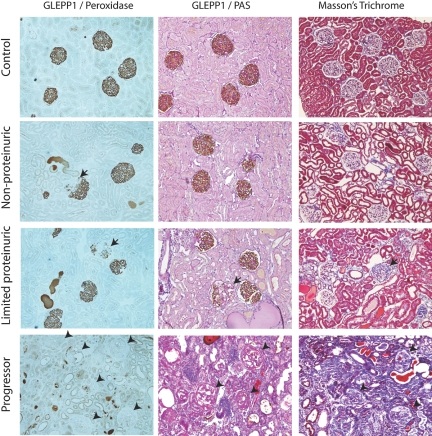
Figure 2.
Representative histology for each group: Podocytes were identified using GLEPP1/peroxidase staining shown without counterstain (left) and with periodic acid-Schiff (PAS)/hematoxylin counterstain (middle). Masson's Trichrome staining is shown on right. From top to bottom, micrographs are from control, nonproteinuric, limited proteinuric and progressor groups. Note that progressors showed almost total loss of peroxidase product indicating loss of almost all podocytes in association with progression (glomeruli shown by arrowheads). In contrast the limited proteinuric group showed patchy loss of podocytes from some glomeruli (arrows). The nonproteinuric group showed an occasional glomerulus with patchy podocytes loss (arrow). Progressors showed extensive interstitial scarring as indicated by Masson's Trichrome staining. Limited progressors showed patchy interstitial scarring.

