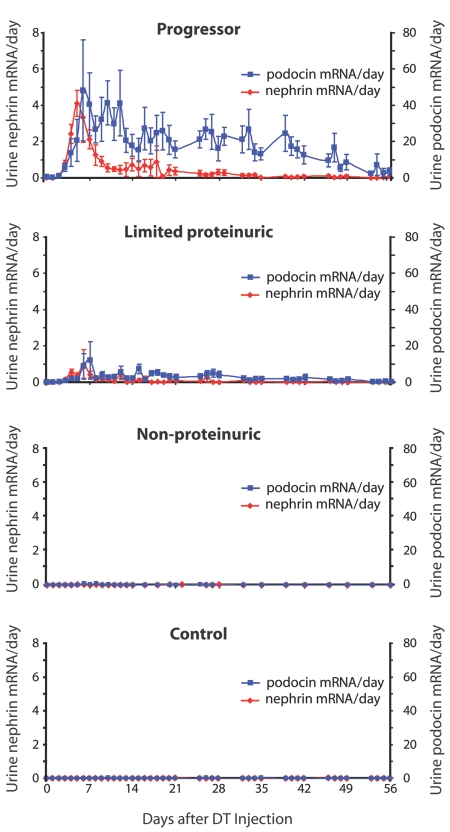
Figure 6.
Comparison of urine nephrin and podocin mRNA excretion between groups through day 56: The progressor group excreted high-level urine nephrin mRNA (red) as an initial peak followed by low-level mRNA excretion. Podocin mRNA (blue) was excreted persistently throughout the time course. A similar pattern but reduced in quantity was seen for the limited proteinuric group. Unless otherwise specified, units are arbitrary, based on standard curves from wild-type animals as described in the Concise Methods section.

