Figure 7.
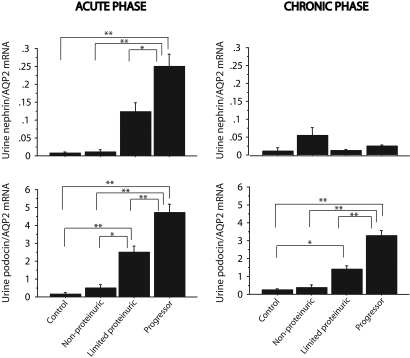
Urine nephrin and podocin mRNA expressed as a ratio with AQP2 mRNA. In the acute phase (left), both nephrin:AQP2 (top) and podocin:AQP2 (bottom) mRNA ratios were highest in progressors and still significantly increased in limited proteinurics. In the chronic phase (right), only urine podocin:AQP2 (bottom) ratios remained significantly increased. *P < 0.05 and **P < 0.01 as assessed by Kruskal-Wallis test and then Scheffe test.

