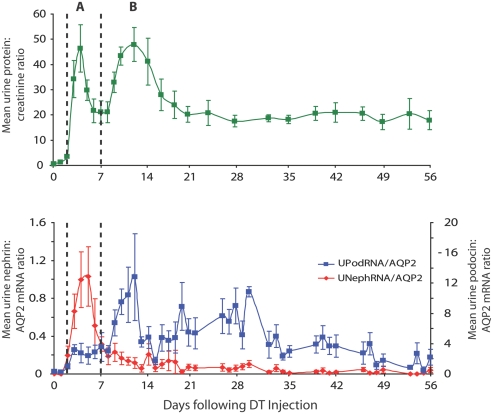
Figure 8.
Time course of proteinuria versus urine nephrin:AQP2 and podocin:AQP2 excretion in progressors. The urine protein:creatinine ratio profile (top) shows two peaks (A and B) during the initial injury phase as indicated by the dotted lines. The first peak (A) corresponds temporally to the nephrin:AQP2 mRNA peak, and the second peak (B) corresponds to the podocin:AQP2 peak (bottom). Persistent proteinuria during the chronic phase of progression corresponds to continued high-level podocin:AQP2 and low-level nephrin:AQP2 mRNA excretion.

