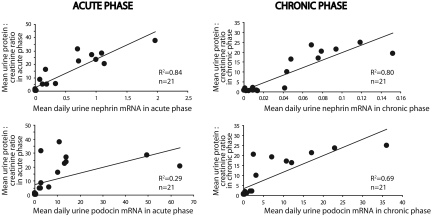
Figure 9.
Relationship between proteinuria and mRNA excretion of urine nephrin and podocin: In the acute phase (left), proteinuria correlated highly with urine nephrin mRNA excretion (top; r2 = 0.84) but not with urine podocin mRNA excretion (bottom; r2 = 0.29). In the chronic phase (right), both nephrin and podocin mRNA correlated with proteinuria (r2 = 0.80 and 0.69, respectively). Unless otherwise specified, units are arbitrary, based on standard curves from wild-type animals as described in the Concise Methods section.

