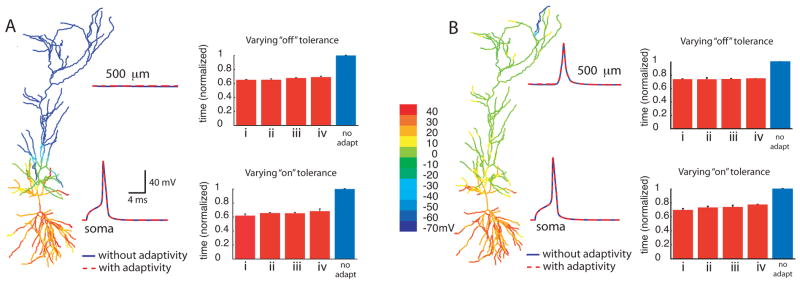
Figure 3.
Dichotomy of action potential backpropagation with adaptivity. In the case of weak backpropagation, A, an action potential initiated in the soma fails to invade the distal dendrites, but in the strongly backpropagating case, B, an action potential in the soma creates a dendritic spike, even in the distal dendrites. Peak voltage is shown color-coded in the morphological reconstruction. The voltage traces at the two locations in both cases were made without adaptivity (solid traces) and with adaptivity (dashed traces). The upper bar graph for each case shows normalized computing times for simulations done with fixed “on” tolerance, and various “off” tolerances. The “on” tolerance was fixed at 0.010 and Vtol was set to 5 mV. The“off” tolerances used were: (i) 0.007, (ii) 0.005, (iii) 0.003, and (iv) 0.001. The lower bar graphs for each case show computing times for simulations done with fixed “off” tolerance, and various “on” tolerances. The “off” tolerance was fixed at 0.005, and Vtol was set to 5 mV. The “on” tolerances used were: (i) 0.014, (ii) 0.012, (iii) 0.010 and (iv) 0.008. In both panels, the traces were made using an “on” tolerance of 0.008, an “off” tolerance of 0.005, and Vtol = 5 mV. The peak depolarization is indicated with color. In all bar graphs, each bar represents averages of 10 trials of simulations run until 10 ms. Scale bars are standard deviation.

