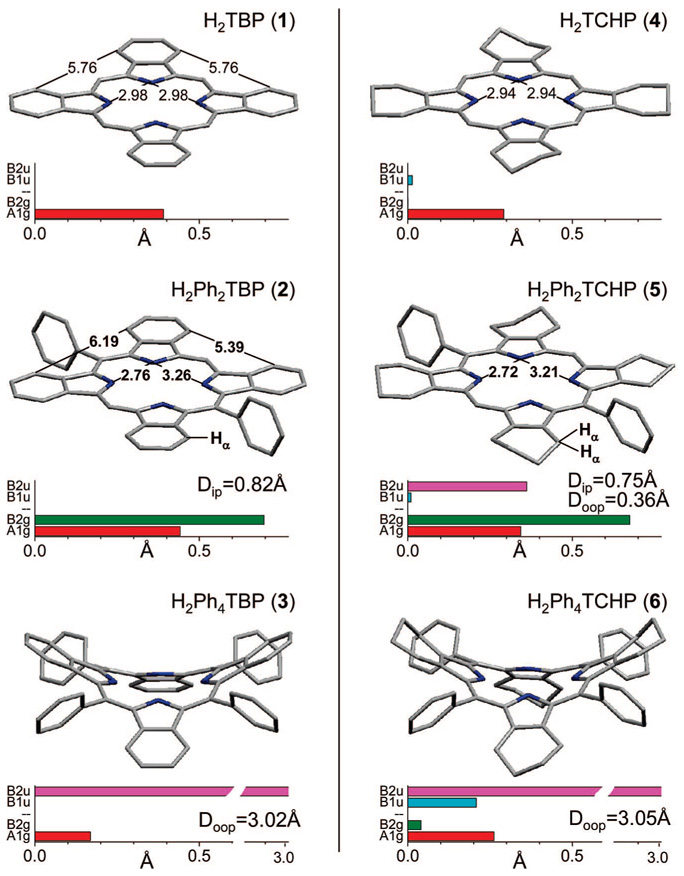
Figure 3.
Computed structures (DFT B3LYP/6–31G(d)) of H2PhnTBP’s (left column) and PhnTCHP’s (right column) (n = 0, 2, 4). Distances are in Å. Main distortion modes, recovered by the NSD analysis,22 are shown by the bar graphs. In-plane distortions: A1g, red; B2g, green. Out-of-plane distortions: B1u (ruffling), cyan; B2u (saddling), magenta. (For complete list of modes see Supporting Information, V). Doop and Dip designate total mean-square out-of-plane and in-plane displacements, respectively.

