
Figure 3.
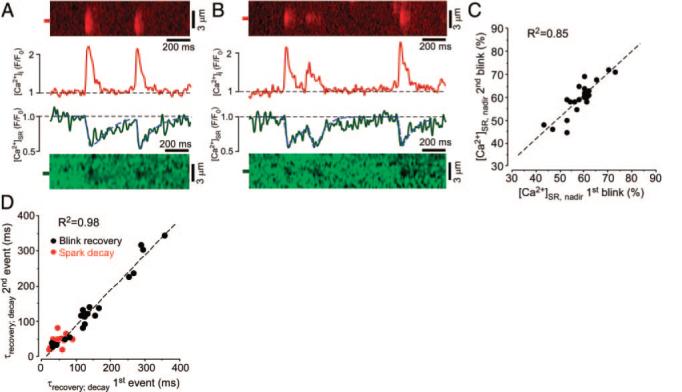
Ca2+ blinks originating from the same release site. A, Line scan images and corresponding profiles of 2 consecutive Ca2+ sparks and blinks originating from the same release site. Profiles of sparks and blinks were obtained by averaging fluorescence from the regions marked by the 1-μm-wide red and green boxes, respectively. B, Similar recordings of multiple release events and corresponding blinks from a different SR Ca2+ release site. C, Relationship between [Ca2+]SR at the nadir of consecutive blinks ([Ca2+]SR, nadir), originating from the same release site. D, Relationship between blink recovery time constants (black data points) and spark decay time constants (red data points) of consecutive release events from the same release site. Time constants were measured from concurrent sparks and blinks.