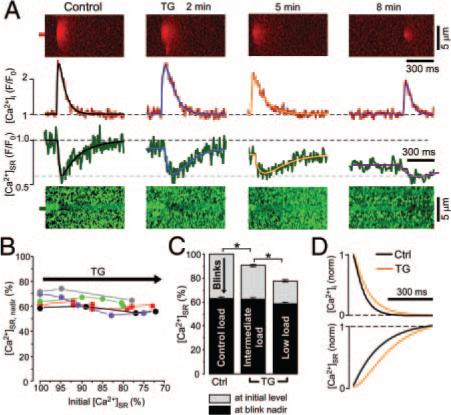
Figure 4.

Ca2+ sparks and blinks at decreased [Ca2+]SR. A, Line scan images and corresponding profiles of Ca2+ sparks and blinks originating from the same release site under control conditions and at different times following thapsigargin (TG) (10 μmol/L) application. Spark and blink profiles were fitted with a double exponential function (black, blue, orange, and purple lines). B, Relationship between the initial [Ca2+]SR and the [Ca2+]SR at the blink nadir ([Ca2+]SR, nadir). Data were obtained from different Ca2+ release sites (indicated by different colors) during thapsigargin application and were normalized to the initial SR Ca2+ load before thapsigargin application (100%). C, Summary of results shown in B with data grouped into control (100%), intermediate (85% to 95%), and low (70% to 80%) initial [Ca2+]SR level. Initial [Ca2+]SR (SR Ca2+ load before release) represented in gray with [Ca2+]SR at the blink nadir shown in black. D, Normalized decay of Ca2+ sparks and corresponding recovery of blinks under control conditions (black) and in the presence of 10 μmol/L thapsigargin (orange). The profiles were obtained from exponential fits of experimental traces in A (control and thapsigargin, 5 minutes). *P<0.05.
