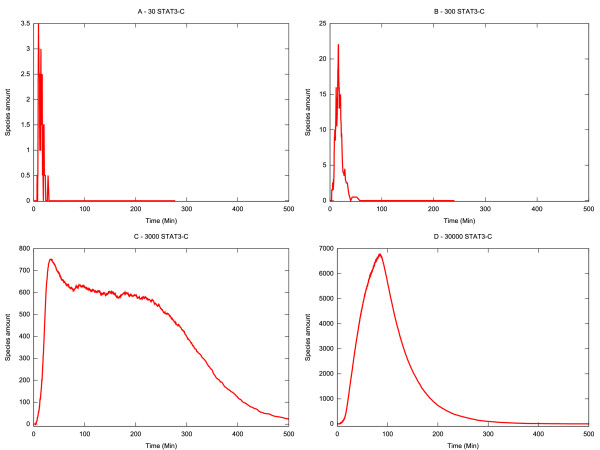
Figure 3.
Single parameter sensitivity analysis: variation of STAT3 initial amount. The evolution of the system has been observed varying the initial amount of STAT3. (A) 30 molecules. (B) 300 molecules. (C) 3000 molecules. (D) 30000 molecules. The amount of active nuclear STAT3 (STAT3-PDN) is plotted.

