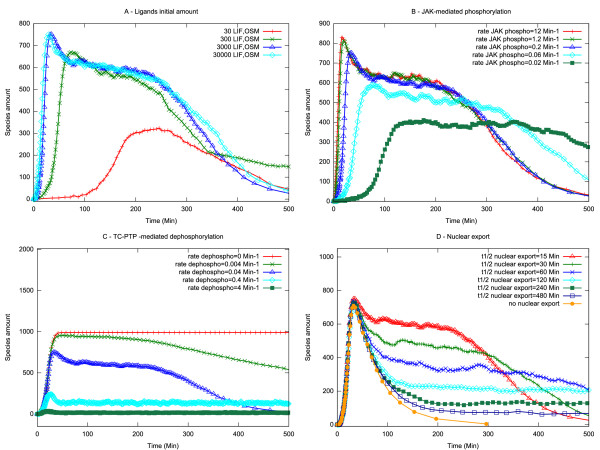
Figure 4.
Single parameter sensitivity analysis. The evolution of the system has been observed varying each parameter individually. (A) Ligands initial amount. (B) JAK-mediated phosphorylation. (C) TC-PTP-mediated de-phosphorylation. (D) Nuclear export. The amount of active nuclear STAT3 (STAT3-PDN) is plotted.

