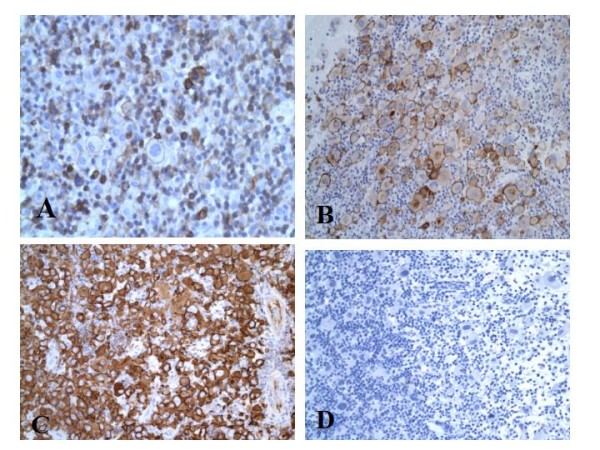
Figure 2.

A, B, C, and D. Tumor cells positive for immunostain for LCA × 200 (A), Tumor cells positive for immunostain for EMA × 200 (B), Tumor cells positive for immunostain for CD30 × 200 (C), Tumor cells negative for immunostain for ALK-1 × 200 (D).
