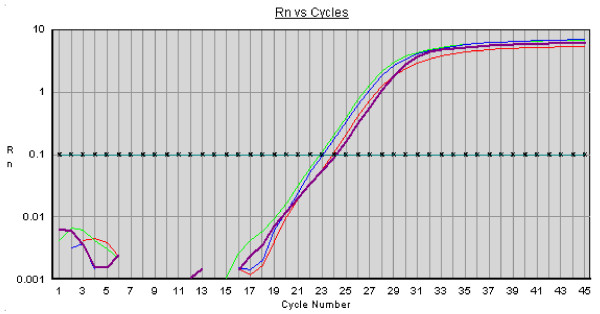
Figure 3.
QRT-PCR of BM-MSCs for the Nanog, Oct4, Sox2 and GAPDH genes. Plot of QRT-PCR of Nanog (violet), Oct4 (green), Sox2 (blue) and GAPDH (red) on cDNA from BM-MSC cells. Cycle number is shown on the X-axis and emission intensity of a fluorescent reporter (Rn) is shown on the Y-axis. Fixed threshold is indicated as horizontal line.

