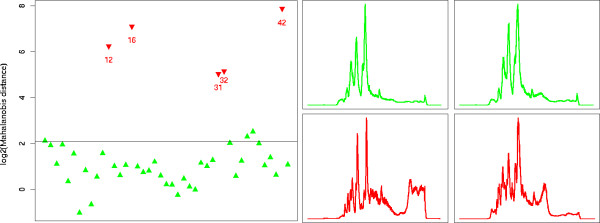
Figure 7.
Results on LC-MS maps of a BSA digest. Left: Log-scaled Mahalanobis distances for the BSA digest. The black line gives a cutoff for a significance level of 5%. Good runs are given in green up-pointing triangles and simulated outlier are given in red down-pointing triangles. The numbers denote the time order of the runs, but are only given for the outlier runs. Right: Examples of LC-MS maps classified as good (green) and outlier (red).

