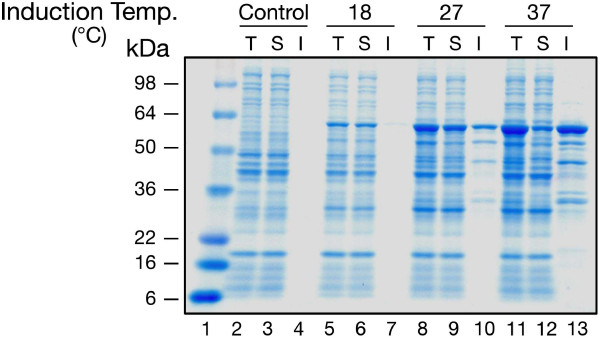
Figure 2.
Analysis of MK2(47–366, T222E) expression as a function of temperature. Total, soluble, and insoluble fractions (see Methods) were separated by 4–20% SDS-PAGE; stained with Coomassie Blue. Lanes: (1) MW markers; (2–4) control (uninduced); (5–7) 18°C; (8–10) 27°C; (11–13) 37°C;. T, total; S, soluble; I, insoluble. All samples were taken 5 h after induction with IPTG. See also Table 3.

