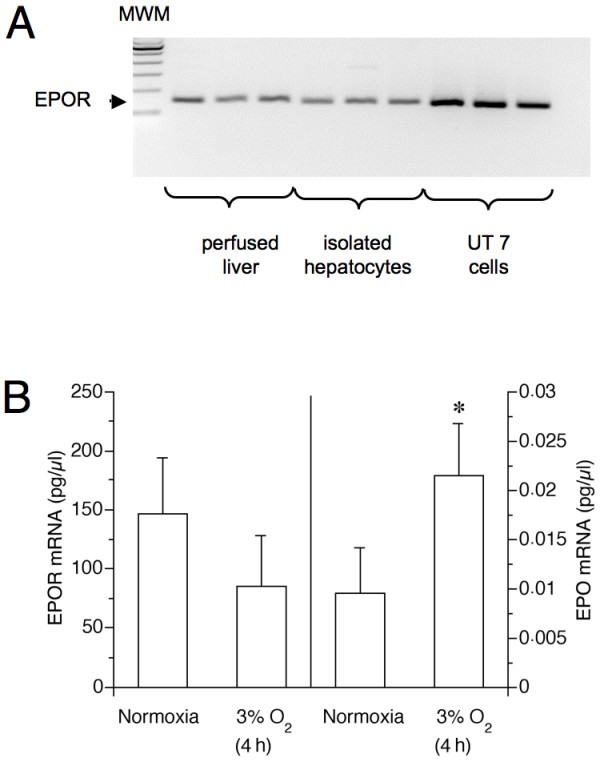
Figure 5.

Oxygen dependence of hepatocyte mRNA expression of EPOR and EPO. (A) qualitative PCR of EPOR cDNA reverse transcribed from mRNA. Subsequent to their isolation hepatocytes were cultured in L-15 medium (37°C) for 20–22 hours at normoxia (74% N2/21% O2/5% CO2). Total RNA was extracted from the hepatocytes or from fresh tissue of perfused livers. Using primer EPOR1 and EPOR2 (see Methods), a single PCR product (arrow) was obtained which was sequenced and proved to be from the EPOR. For comparison, data from UT-7 cells ate shown. Levels of EPOR mRNA in liver tissue were around 152 ± 27 pg/μl RNA. (B) Real time PCR quantitation of EPOR and EPO mRNA. Hepatocytes were incubated for further 4 hours under normoxia or hypoxia (3% O2). Afterwards total RNA was extracted as in (A). 5 to 6 samples per treatment were analysed. Shown are mean values + S.D. *p < 0.05 vs. respective incubations at normoxia; MWM: molecular weight marker.
