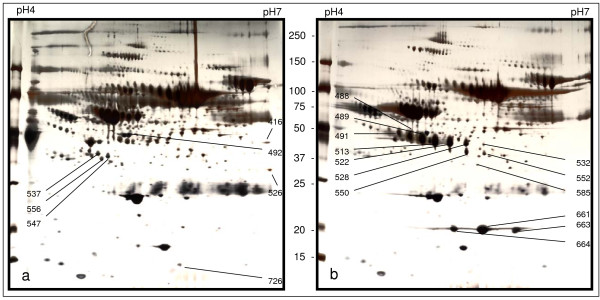
Figure 1.
A paired 2-DE gel images from a patient with cGVHD. Gel a). represents the protein 2-DE gel profile of the serum from the patient before cGVHD development. Gel b). represents the protein 2-DE profile of the serum derived from the patient with cGVHD. The protein spots labeled with numbers were collected, digested and analyzed by Mass spectrometry.

