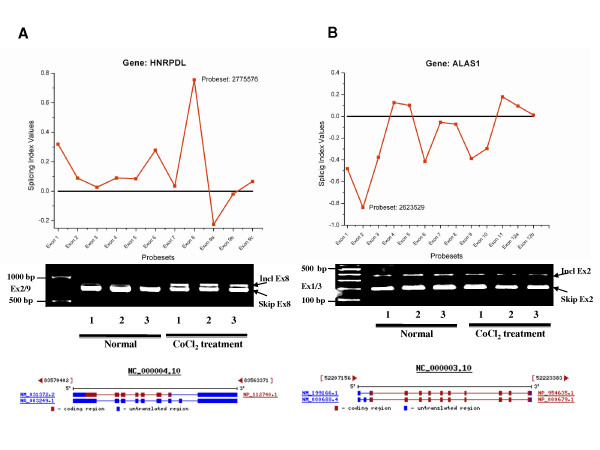
Figure 3.
Consistency among results of exon array, RT-PCR and isoform evidence from RefSeq database. The "Splicing Index" value measures a quantitative change in the exon expression between mimicked hypoxia and normoxia samples. A: The HNRPDL gene, mimicked hypoxia-specific "Splicing Index" values illustrated for isoform supported exons and RT-PCR validation using primers located in flanking exons. B: The ALAS1 gene, illustrated as in A.

