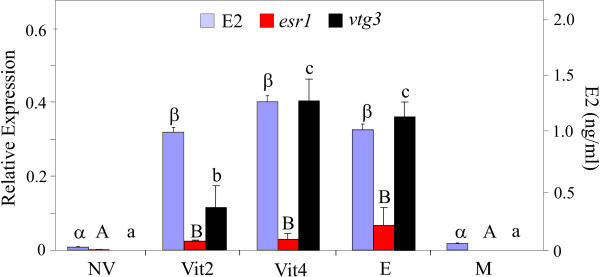
Figure 2.
Plasma levels of E2 and expression ratios of esr1 and vtg3 tested by RT-PCR. Gene expression levels were normalized to ef1a and expressed as Mean +SD (n = 3 pools). The letters α and β indicate significant differences in the E2 levels. The letters A, B and a, b, c denote significantly different expression levels of esr1 and vtg3, respectively. E- E2-treated males, Vit2 or Vit4- 2- or 4-month old vitellogenic females, respectively, NV- Non-vitellogenic females, M- control males.

