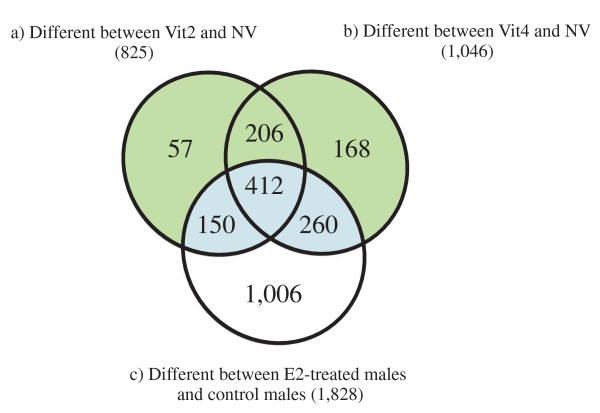
Figure 5.
Number of transcripts putatively associated with vitellogenesis or E2 treatment of males. A Venn diagram showing the number of transcripts differing significantly between vitellogenic and non-vitellogenic females and putatively associated with E2 regulation: a) Transcripts of genes significantly different between two-month old vitellogenic females (Vit2) and non-vitellogenic females (NV). b) Transcripts of genes significantly different between four-month old vitellogenic females (Vit4) and NV, and c) Transcripts of genes significantly different between E2-treated males and control males. Combination of these three comparisons by Venn diagram illustrates the number of genes differing during vitellogenesis and putatively regulated by E2 (colored pale blue), genes differ during vitellogenesis putatively not directly regulated by E2 (colored light green) and genes unique to males (colored white).

