Figure 3.
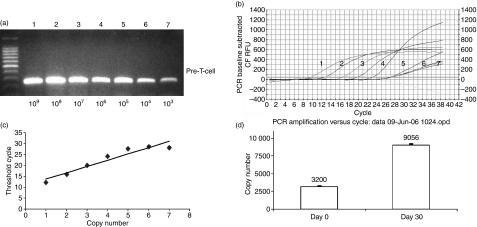
Normalized expression results for the T-cell receptor obtained using real-time polymerase chain reaction (PCR). (a) Pre-T-cell receptor copy number related to band densities: lane 1, 109; lane 2, 108; lane 3, 107; lane 4, 106; lane 5, 105; lane 6, 104; lane 7, 103. (b) PCR baseline subtracted relative fluorescence units (RFU) curve related to T-cell receptor sample copy numbers: lane 1, 109; lane 2, 108; lane 3, 107; lane 4, 106; lane 5, 105. (c) Relationship between threshold cycle and pre-T-cell receptor copy number: lane 1, 109; lane 2, 108; lane 3, 107; lane 4, 106; lane 5, 105; lane 6, 104; lane 7, 103. (d) Quantitative change in T-cell receptor expression on days 0 and 30.

