
Fig. 5.

Extrema of the membrane potential during the up-state ( and
and  ) and normalized phase difference (
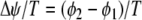 ) for a two-unit network when either the internal coupling strength (a) or the synaptic weight (b) is varied. Lower figures demonstrate the presence of complex dynamics in specific region of the upper figures by showing the bifurcation diagram for the local minima of the membrane potential. For (a), w = 0.75. For (b), σ = 0.9