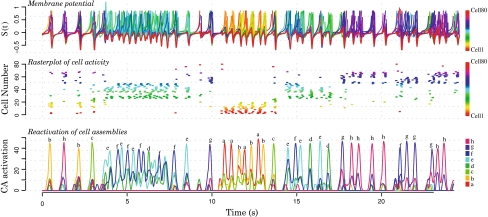
Fig. 7.
Spontaneous activity in a 80 units network containing eight overlapped cell assemblies of 10 cells each. The upper and the middle figures show respectively the membrane potential and a rasterplot of the activity of each individual cell (one color per cell). The lower figure shows the reactivation of the different cell assemblies (each assembly has its own color and letter). Periods of no-activity alternate with periods of activity during which specific cell assemblies are preferentially activated

