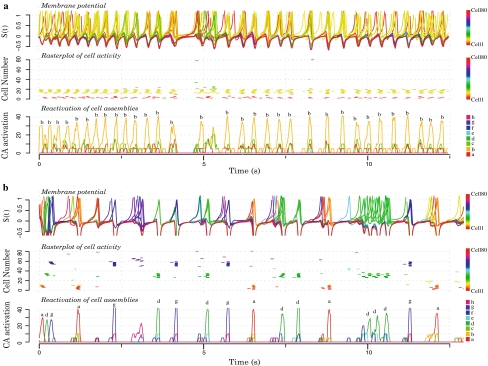
Fig. 8.
Working memory in a 80 units network containing eight overlapped cell assemblies of 10 cells each. In both a and b, upper figures show the membrane potential of each individual cell (each cell one color). Middle figures show rasterplots of individual cells activity (a cell is said to be in an active state if its spike density is larger than 0.5). Lower figures show the reactivation of the different cell assemblies (one color and letter per cell assembly). a An external stimulus was impinging part (40%) of one cell assembly during a short transient (10 computational time steps). As a result, this cell assembly is continuously activated as a short term memory. b External stimuli are successively applied to part (40%) of three cell assemblies (each CA is stimulated during 100 computational time steps; i.e. approximately 200 ms). After stimulation, we observe that these three cell assemblies have sustained activity

