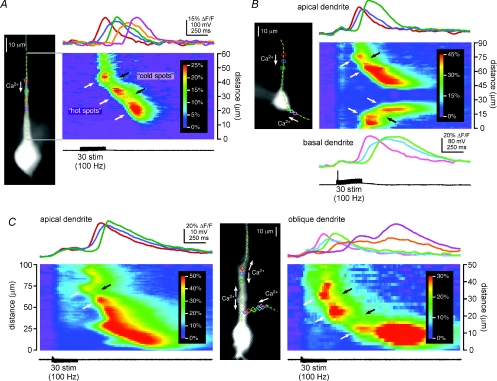
Figure 1. Synaptically triggered Ca2+ waves propagate through hot spots and cold spots.
A: left, Alexa fluorescence image of a representative CA1 hippocampal pyramidal neuron filled with the Ca2+-sensitive dye fura-2FF. Coloured rectangles define regions of analysis, and the dashed green line identifies the position of the pseudo-linescan; right, Ca2+ signals in the analysis regions and along the analysis line during the propagation of a Ca2+ wave triggered by synaptic stimulation. The amplitude and rate of rise of the Ca2+ wave were high where it initiated at 45 μm in the red region (a hot spot), decreased as the wave propagated through the blue region at 40 μm (a cold spot) and increased again as the wave propagated into the green region at 34 μm (another hot spot). The amplitude and rate of rise subsequently decreased and increased again as the Ca2+ wave propagated through an additional cold spot in the orange region at 28 μm into a final hot spot centred on the purple region at 21 μm. Hot spots and cold spots appear in the pseudo-linescan as warmer and cooler colours, and are indicated with white and black arrows, respectively. The stimulation that triggered this Ca2+ wave evoked no action potentials (see black voltage trace). B: left, image of a layer V medial prefrontal cortical pyramidal neuron filled with the Ca2+ indicator bis-fura-2 and showing the position of the analysis line and the analysis regions; right, synaptic stimulation triggered Ca2+ waves in both the primary apical dendrite and a basal dendrite of this neuron. The waves in both dendrites propagated from regions of relatively larger amplitude (hot spots; red and pink regions at 75 μm and 15 μm, respectively) through regions of smaller amplitude (cold spots; blue and sky blue regions at 70 μm and 20 μm, respectively) into regions of larger amplitude again (hot spots; green and lime regions at 65 μm and 25 μm, respectively). The rising slope of the Ca2+ signal, i.e. its rate of rise, was greater in the hot spots than it was in the cold spots. The stimulation shown here evoked a single action potential and accompanying voltage-dependent rise in [Ca2+]i, evident as a simultaneous and uniform, small increase in the Ca2+ signal in all dendritic analysis regions. C, synaptic stimulation of this bis-fura-2-filled CA1 pyramidal neuron triggered Ca2+ waves in both the primary apical dendrite (left) and in an apical oblique dendrite (right). Left pseudo-linescan and optical traces: the Ca2+ wave in the primary apical dendrite initiated in the red region at 78 μm (a hot spot) and propagated through the blue region at 68 μm (a cold spot) before proceeding into the green region at 60 μm (another hot spot). Right pseudo-linescan and optical traces: the Ca2+ wave in the apical oblique dendrite initiated in a hot spot centred on the pink region (35 μm), propagated through a cold spot in the sky blue region (30 μm) into a second hot spot in the lime region (25 μm), and then passed through a second cold spot in the orange region (18 μm) before reaching a final hot spot at the dendrite's branch point in the purple region (12 μm). The biphasic Ca2+ signal in the purple region represents a summation of [Ca2+]i increases arising first from the Ca2+ wave that originated in the apical oblique dendrite and then from the Ca2+ wave that originated in the primary apical dendrite. Both the amplitude of the Ca2+ signal and its rising slope were greater in the hot spots than in the cold spots. No action potentials were evoked by this stimulation. This cell was bathed in high divalent (4 mm Ca2+ and 5 mm Mg2+) recording ACSF containing 10 μm glycine, 50 μm gabazine, 100 μm d,l-APV, and 1 μm CGP55845.

