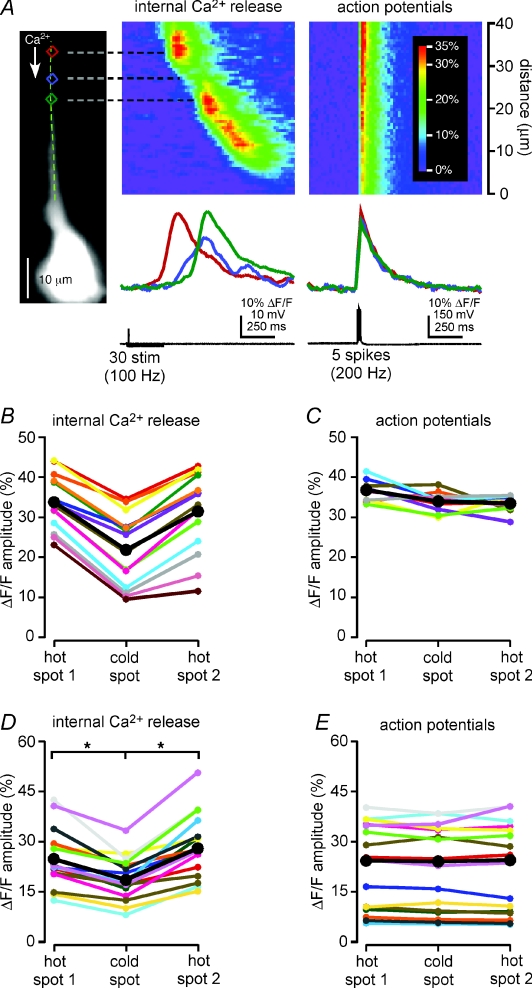
Figure 5. Dendritic Ca2+ signals evoked by action potentials do not exhibit hot spots and cold spots.
A, left, a CA1 pyramidal neuron filled with bis-fura-2. Left pseudo-linescan and traces, synaptic stimulation triggered Ca2+ waves that varied in amplitude as they traversed the primary apical dendrite. The amplitude of the Ca2+ signal was largest in the two hot spots centred on the red and green analysis regions and smallest in the cold spot in the blue analysis regions between them. Right pseudo-linescan and traces, large, brief current injections were used to trigger five action potentials in the same cell. The amplitude of the Ca2+ signal produced by the action potentials was nearly uniform along the same length of the primary apical dendrite and in each of the red, blue and green analysis regions. The data depicted here represent an average of ten episodes. B, the amplitudes of Ca2+ signals were greater in the hot spots than in the cold spot in all 15 Ca2+ waves observed in this cell. Mean values are shown in black. C, in contrast, each of ten bursts of action potentials produced Ca2+ signals of nearly identical amplitude in all of the first hot spot, the cold spot and the second hot spot. Mean values are shown in black. D, plot of the mean amplitudes of Ca2+ signals evoked by synaptic stimulation for 16 hot spot–cold spot–hot spot sequences from 14 neurons. The amplitudes of Ca2+ signals were significantly greater in the hot spots than in the cold spot. Means are shown in black. E, plot of the mean amplitudes of Ca2+ signals triggered by brief trains of action potentials (1–5 spikes at 100–200 Hz) for the same 16 hot spot–cold spot–hot spot sequences depicted in D. Hot spots and cold spots exhibited nearly identical [Ca2+]i rises during trains of action potentials. Means are shown in black. Statistical significance was determined using Student's paired t tests (*P < 0.0001).

